Over the past three seasons, reigning back-to-back league MVP Stephen Curry averaged 79 games-per-season and yet his ankles remain a delicate arc of his historical narrative. From the customized high-ankle-support Under Armour shoes to his lean build to his physical breakdown in the 2016 playoffs, Curry’s health seems to be a talking point that always lingers kind of like the vinegary sweat smell from my buddy G’s high school practice jersey. It’s a funk that still makes Golden State fans and league office employees cringe when Steph hits the deck.
Connected to Curry’s health is the direct correlation to the Warriors’ collective success. Health isn’t an absolute, but from the start of the 2014-15 season to Curry slipping on a wet spot against the Rockets in the opening round of the 2016 playoffs, the Warriors won 156 of 185 games (84%). After Curry’s injury, they went 15-9 (63%).
Steph’s health, among so many other variables, is a critical piece of his team’s success. This isn’t a relationship unique to Golden State or Steph, but something that pervades any team sport, particularly those where each team only fields five players at a time. With that in mind, I looked at missed games over the previous three seasons in some attempt to understand who’s getting hurt, how much time they’re missing, and understand that every time they go away, what part of the team are they taking with them – be it potential or points-per-game or whatever.
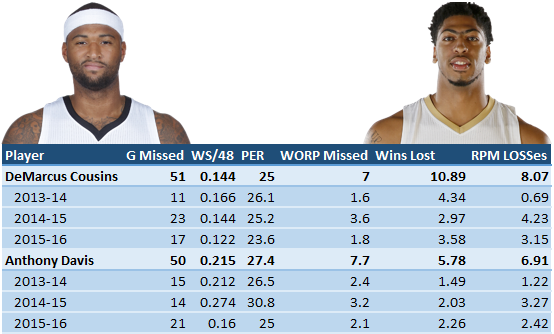
Like many NBA fan, I’m intrigued by Anthony Davis’s young career. The most unique talents suffer under the greatest microscopes and so it is that we needle away at Davis’s four-year career. Sticking with the three-year baseline I established, Davis has missed 50 games with 15-16 being his most injurious at 21 games missed. But so what? What do the Pelicans lose when Davis is gone?
Depending on how you look at it, they miss a lot. By traditional measures, Davis takes with him 23-points and 10-rebounds, 2.5 blocks and nearly 1.5 steals while shooting 51% from the field and 78% from the line on nearly 8 attempts-per-game. (Or, he takes with him 50-points, 16-rebounds, and 7-steals; the line he audaciously produced in the 16-17 season opener.) But how does that impact the team? There’s no single measure to identify wins lost, but there are a handful of win-share or replacement-level stats that can be inverted into a form of loss-share.
There’s WORP/WARP which is Wins Over/Above Replacement Player that is an extension of VORP (Value over replacement player). Then there’s team record with and without a player which is a simplistic, raw way to look at impact which I’ve boiled down a single lost wins number based on variance in win-percentage in games the player played versus games he missed (example: in 2014-15, OKC won 66.7% of the 27 games in which Kevin Durant appeared. They won 49.1% in the 55 games he missed. Apply the 66.7% to the 55 games he missed and you land at ~37 wins. Subtract from that 37 the 27 wins OKC had without him and the lost wins comes out to 9.67.) And finally, there’s ESPN’s RPM (Real plus-minus) model which offers up a metric simply titled RPM Wins which estimates the “number of wins each player has contributed to his team’s total for the season” and includes RPM and a number of possessions played.
For each of the above stats (WORP, Raw Won-Loss, and RPM Wins), I’ve created a negative metric – WORP becomes WORP missed, Raw Won-Loss becomes Raw Wins Lost, and RPM Wins becomes RPM Losses. None of these should be viewed as standalone metrics, but rather as directional insights to get a sense of what’s being lost when a player sits.
If we stick with Davis, we see a fairly consistent measure across the three metrics. For the 15-16 season where he missed 21 games, his WORP landed at 2.1, Wins Lost was 2.3, and RPM losses was 2.4. While there are a silly number of variables that play into the actual on-court results (like Jrue Holiday missing 17 games and sitting back-to-backs while playing limited minutes or Ryan Anderson missing 16 games, Alvin Gentry as new coach, and on and on), by current available measures, the loss of Davis, while no doubt a disruption to continuity and scheme, likely cost New Orleans 2-3 wins.
If we think about how the weight of performance can sway these metrics, let’s compare Davis’s most recent three seasons:

Though Davis missed his most games in 15-16, the performance-based measures of RPM Losses and WORP Missed indicate a more significant impact in 14-15.
Davis is an instructive case for this exercise. He’s consistent both in terms of his on-court outputs and won/loss measures. To-date you can pencil him in for a PER over 25 and somewhere between 15-20 missed games while costing his team 2-4 wins through his absences. And given that he suffered a mild ankle sprain in the pre-season, it’s fair to assume that the trend will continue to some degree.
Conversely, there are players who have missed huge chunks of games that make this exercise completely futile or reveal the weaknesses in these measures. Paul George is the outlier of outliers, a player whose games played have wildly swung in both directions:
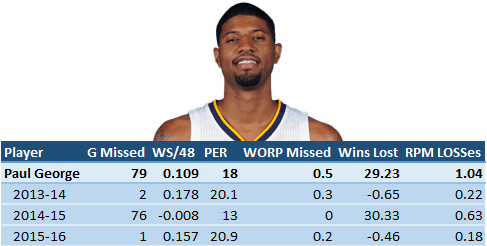
For players who miss a handful of games in a season, the resulting impacts are minimized as to barely register by any of the loss-based measures (see PG’s 13-14 and 15-16). Conversely, George’s 14-15 where he missed 76 games recovering from his gruesome broken leg in the Olympic trials, then came back and helped lead the Pacers to a 5-1 (83.3%) record in the six games he appeared, the value of the Wins Lost, while possibly accurate, is grossly skewed. Indiana was 33-43 (43.4%) in 76 George-less games so when applying PG’s 83.3% win rate to the 76 missed games, the model shows the Pacers missing out on 30 wins which means they would’ve gone 63-19. Meanwhile, his overall 6-game output is so small that his overall impact barely register on RPM or WORP.
To add additional context to George, his 30.33 wins lost is laughably higher than anyone else in this data set over the previous three seasons:

The data does help to illustrate some of my own misperceptions and nowhere is that clearer than comparing Davis to DeMarcus Cousins. The biggest knock against Davis to-date has been his inability to stay on the court. For Cousins, it’s his volatility, his lack of emotional maturity which reveals its ugly head in his missed games. Per Sportrac, Cousins has been suspended six games over the past three seasons. That doesn’t account for all 51 he’s missed in that time – which is one more than Davis – but it’s a significant number.
While Davis is the superior player by nearly any measure, particularly any efficiency measure, the overall impact of Cousins’ missed games is on par with or exceeds Davis. Again, this isn’t to say Cousins is a better player as there are countless variables. It could entirely be that New Orleans has had superior coaching, an easier schedule, or are better equipped to maintain some degree of continuity in Davis’s absence. By most available measures though, Cousins is just as likely to miss games as Davis and those absences adversely impact his team more so than Davis’s with New Orleans. This isn’t necessarily how I’ve thought about both players and their impacts or reputations.
One ugly trend that stood out like a pus-oozing sore on a replacement player’s naked big toe was the Pelicans’ magnetism to injury. Five of their top players over the past three seasons have each missed 50 games or more which translates into a rough average of nearly 27 games missed per-player-per-season. The culprits have been Holiday (35 games/season, currently out indefinitely as his wife undergoes brain surgery), Anderson (32 games/season, gone to the Rockets), Eric Gordon (25 games/season, gone to Rockets), Tyreke Evans (23 games/season, out until maybe sometime in December and apparently had blood clotting in his calf), and of course Davis. The volume, consistency, and unpredictability (particularly Holiday) make this team a wild card in terms of predictability. And if the Pelicans’ first three games of the season were an indication, the non-injured supporting cast around Davis resembles a mix of flunkies and rotation players with Lance Stephenson vying with Tim Frazier as Robin to the Brow’s Batman. As I look over these numbers, it’s hard to fathom how they even made the playoffs in 14-15, though the semi-obvious answer is Davis’s historical season as he recorded a PER north of 30 for just the 18th time in league history.

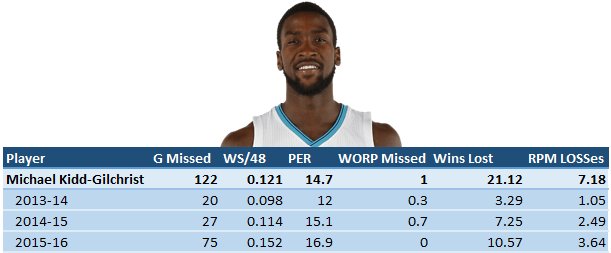
Phoenix’s Eric Bledsoe and Charlotte’s Michael Kidd-Gilchrist stood out for their respective impacts and consistency. For players I bucketed as “starters,” they finished 1st (MKG) and 5th (Bledsoe) in total games missed over the past three seasons. MKG missed 75 games last season with a shoulder injury, but it wasn’t exactly a new trend as he missed 27 and 20 games the previous two seasons. For Bledsoe, he’s had multiple meniscus injuries and missed 39 in 13-14 and 51 last season.
Both players accompany those costly missed game counts with significant impacts in the win/loss measures. MKG with his average-to-below-average stats doesn’t fare well in WORP measures (0.3, 0.7, 0), but looks tremendous in Raw Lost wins (3.3, 7.3, and 10.6 – though the last one falls in the Paul George 14-15 bucket given he only played 7 games). Additionally, MKG’s impact almost falls in the historic Shane Battier corollary of intangibles as articulated by coach Steve Clifford: “Last year, obviously, we played well without him. The first two years that we were here, literally when he played, we played well, and when he didn’t, we couldn’t win. He impacts winning in so many ways.”
Bledsoe’s won/loss impact is well-represented across any of the three measures I’m using:

With Bledsoe on the floor, Phoenix is winning roughly 5-8 more games each season. Like New Orleans, the Suns have experienced maddening volatility over the past few seasons. In-season coaching changes, injuries, and locker room deterioration catalyzed by the Suns trading away one of the Morris twins destabilized the hell out of this team. Amidst all that disarray, Bledsoe, aka Baby LeBron, missing 91 games was the icing on the pain cake. As the Suns best player, he has the appearance of being the single most important player to the Suns’ success. What happened to the days of Phoenix’s training squad stitching together the careers of Steve Nash and Grant Hill? Where for art thou Eric Bledsoe’s health?
Injuries are the scourge of sports. They cost teams and cable networks money, muddy the waters of historical context, force us to question the outcomes of competitive contests; they’re annoying, they’re painful, heartbreaking dings, pulls, tears, and breaks that act as a kick to the groin or a slap upside the head. Injuries suck. And yet, our bodies are fallible and fragile; we live in the suck. And every game, every minute missed comes with some cost. Sleep well tonight friends, because we never know when our favorite player might step on a rake and have the handle swing up and smack him in the face and nose leaving them concussed with a broken nose and an uncomfortable seat at the end of the bench in street clothes.